Red Meat Big Data Fusion
There once was a very nice high school math teacher who would quiz the class math questions. As an overly simplified example, she might ask what is “2 + 2?” If the class vacillated or otherwise seemed unsure, she would continue to ask what is “2 + 2 this week?” as if the answer might change from week to week. Of course, the answer does not change. In mathematics, there is a right answer. It is a human construct where we have full control. We just need to formulate the mathematical proof.
Does processed red meat cause cancer? Does it cause cancer this week? The World Health Organization (WHO) has weighed in on the matter and processed red meat is now classified as a known carcinogen.
Much has already been said over the past month in particular and past decades in general in terms of opinionated accusations and counter accusations, of bribery and of health. That is out of scope. But there are two points to add:
(1) Just as one can take the mystical, intimidating sting out of scary mathematics by putting it in perspective, so can we deal with the mystical scary concept of doctors, scientists, medicine, and cancer. What is the answer this week? There are people behind the numbers and the analysis. Cancer is not a human construct. We are all in this together and we do not have full control.
(2) This is a big data concept. There is much cancer research data now available to process and it is illuminating to highlight the same data processing techniques in medicine as in any other big data endeavor, from marketing to remote sensing/sensor fusion.
The original primary source material for the WHO report is here with excerpted interview here. An international team of 22 France-based scientists reviewed over 800 published literature papers concerning processed red meat and cancers of the digestive tract. They organized the publication data and designed a voting weight scheme that emphasized long term prospective cohort studies over other categories of published research methodologies.
Translation: What is 2+2 this week?
This is not a research study. It is an evaluation of 800-odd research studies. It is a fusion of 800-odd signals connecting processed red meat to digestive cancer. So let us start at the beginning. What do the 800-odd research studies look like?
A typical research study on processed red meat to cancer takes several different forms. The basic forms are: case control study (CC), retrospective cohort study (RC), prospective cohort study (PC), and a double blind randomized controlled trial (dbRCT).
· Case Control (CC): Find people who have cancer. Find people who do not have cancer. Ask both whether they ate processed red meat in the years before their diagnosis.
· Retrospective Cohort (RC): Find people who ate processed red meat. Find people who did not. Ask whether they have developed cancer.
· Prospective Cohort (PC): Find people who eat processed red meat. Find people who do not. Going forward, ask every year whether they develop cancer.
· Double Blind Randomized Controlled Trial (dbRCT): Randomly assign people to group C (control) or group T (trial). Tell both groups C and T they are eating tofu. Give group C real tofu. Give group T processed red meat that looks and tastes like tofu. Screen both groups for cancer, but the screeners have no idea which patient is from which group.
The study forms are ordered from weakest and least reliable (CC) to strongest and most reliable (dbRCT). Sadly, the resource costs follow the same order, with dbRCT being by far the most expensive.
Cancer is thankfully very rare. In a CC study, one might find 5 people who have cancer and 50,000 people who do not. But if 2 out of the 5 people mentioned they had processed red meat while 10,000 out of 50,000 mentioned they had the same, the feature difference is (40% – 20% = 20%) which is a relatively huge difference. What if none of the 5 had any processed red meat? Then it would be (0% - 20% = -20%) which means processed red meat prevents cancer. The sample size difference is so large as to confound most direct comparisons by enhancing data dredging artifacts. There are feature selection / feature recall problems. Was it the processed red meat? Or the orange juice with the processed red meat? Or the proximity to the Washington Red Skins stadium? There is no established baseline or control for either eating processed red meat or for cancer. Maybe there is absolutely nothing different about the 5 people with cancer and the 50,000 people who do not. One cannot know in this setup from which side of any causal feature these 5 people with cancer came. There is no defined boundary.
This is by the way, the exact same setup available among marketing and customer profiling big data firms. Given terabytes of data about 5 visitors who bought a product and 50,000 visitors who did not, ask whether they had processed red meat that morning. Does eating processed red meat cause the visitors to buy the product? A smart marketing modeler knows to triage the visitors: those who are predestined to buy, those who are immune and will never buy, and those who are borderline susceptible. Starting with CC data, how can anyone determine from where those 5 buying customers came? Without this crucial context, the processed red meat question could be so skewed as to be moot. The processed red meat determination is doomed from the start. The most common attempted solutions, that of gathering yet more CC data (now we have 500 buying visitors and 5,000,000 browsing visitors) or even worse, over/under-sampling (randomly pick with replacement from among the 5 buying customers 10,000 times to build 50,000 virtual buyers) only adds more confusion to an ill-formed study.
Cohort studies attempt to fix a baseline for the causal side, in this case eating processed red meat. One group eats processed red meat, and another group does not. RC is a back-tested study by checking to see how many from each group has cancer. PC is a forward out-of-sample testing to see who subsequently develops cancer. PC studies are favored in terms of evidential strength over RC because prospective is forward looking out-of-sample. It is much better at testing whether a relationship continues to hold in the future. The reason it is preferable is because the test conditions are in writing before the relationship test of who develops cancer. Reading between the lines, this is important as the researcher has a harder time cheating. Nobody knows the future. This means the study design methodology acknowledges that the human research testers are human. An RC back-test can be rearranged over and over until an interesting correlation relationship appears and the researcher has no obligation or rule to declare how many attempted fits failed before the correlation. This is not cheating per se since there are no rules or regulations or even interest in knowing the number of researcher attempts. But it can be misleading. PC studies close that route. That is why the 22 researchers quoted by the WHO vote-weighted the long-term PC studies the most.
Except that PC studies merely shift the burden of failed attempts from the researcher to the publication editor. In an RC study, a single research team could try, say, 100 times before finding a correlation on back-test data. This is classic direct data dredging. In a PC study, a single research team could only try once to find a correlation. But the journal editor might receive 100 research teams’ boring studies before finding an interesting correlation relationship to publish. This is classic indirect data dredging.
Further, since all cohort studies start by establishing a baseline on the purported causal factor of who eats processed red meat, they require an a priori assumption. A cohort study cannot find the smoking gun. They can only ask whether a particular suspect has any smoking gun. Since the cohort study already starts with who eats red meat and who does not, it already embeds a certain bias.
“I eat processed red meat.” Ask random people if eating processed red meat is good or bad. Ask whether such a question makes sense. Typically, one would find the question does make sense and that eating processed red meat is unhealthy, gluttonous, evil, immoral, or harmful. Now screen a patient who eats processed red meat for cancer. Cancer is not a brightly colored litmus test. It is not a tag sticking out of someone’s colon. It entails background checks, imaging scans, and subjective bodily health.
· Patient XYZ is tired, lacks appetite, and has some grainy bumps on her imaging scan. She does not eat processed red meat, but has a beautiful baby to take care of. Probably not cancer. Wait and see.
· Patient ABC is tired, lacks appetite, and has grainy bumps on his imaging scan. He eats processed red meat while watching the Washington Red Skins at the local bar while drinking beer. He does not have kids to watch. Probably cancer.
This is hidden data dredging. It is subtle. It cannot be quantified or corrected.
That is why the gold standard is a dbRCT. By controlling the variables, it establishes both baselines and avoids the sampling size issue. Since half the people will eat processed red meat (group T) and half the people will not (group C), the processed red meat consumption is controlled and tracked. The baseline cancer rate is also known from group C. Any difference in cancer rates due to the processed red meat is apparent from group T. Since the groups are random, this filters and rips out any confounding variables. Processed red meat eaters have nothing in common over and above non-processed red meat eaters. And since neither the people nor the screeners have a choice or know who is eating processed red meat, there can be no urge to classify a borderline subject as having cancer or not. It is double blind.
To summarize in pictorial form:
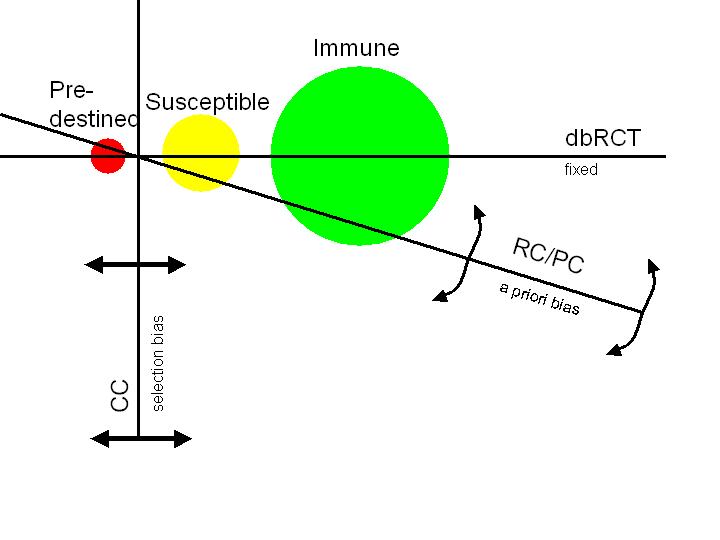
The three circles represent the triage:
- those who are predestined no matter what they do (might as well eat bacon)
- those who are borderline susceptible (bacon may affect cancer)
- those who are completely immune (eat bacon like a big bad wolf and no problem)
The three boundaries represent the research form approach:
- CC is vertical with freedom to move. There is no way to know how many of each triage is included in the cancer/not cancer dichotomy. Therefore there is no way to know where the data is coming from.
- RC/PC is oblique with freedom to rotate. It is much improved since it attempts to include members of all three triages in the red meat/no red meat dichotomy. However, both are highly susceptible to an a priori bias since they start by assuming a relationship that may or may not include equal amounts from each triage. Therefore, hidden prejudices and biases are still present.
- dbRCT is the horizontal and is fixed. It has no room to move and forces equal selection from all three triages. Any difference in cancer rates necessarily must come solely from the susceptible triage and be due to the red meat/no red meat dichotomy under consideration. There is no room to maneuver and allow a bias. This is precisely what we want to test.
Now recall that the WHO-quoted study is not a direct study on processed red meat to cancer. It is a meta-study review of the literature evaluating 800-odd studies that fall within one of the forms described above. Some studies will conclude there is a link for cancer; others will conclude there evidence is against cancer. The task of the 22 review scientists was not to divide 800 patients into cancer/no cancer groups. The task of the 22 review scientists was to divide 800 studies into for cancer/against cancer linkage reports. This is inherently a CC (case control) study on a population of studies. The number might be, say, 350 for / 450 against.
However, not all studies are created equal. Some might include 5 patients. Others may include 1000 patients. Weight the votes according to patient size and the number might become, say, 425 for / 375 against.
But then some studies may span 20 years while others span 1 year. Weight the votes according to study length and the number might become, say, 250 for / 550 against.
Or the scientists might wish to weight the study by type. CC gets 1 vote, RC 2 votes, PC 3 votes, and dbRCT 4 votes. Or should dbRCT get 10 votes?
Or should the scientists focus the task by selecting the top 100 best studies and completely ignore the remainder? Top 10? Top 37?
Making sense out of some 800-odd other teams trying to make sense is in many ways far more challenging than simply trying to make sense of the processed red meat-cancer data. So from a scientific perspective, a great big kudos to the team for even attempting this scale let alone publishing it. This is the big data fusion challenge and it applies here on the processed red meat cancer WHO study as much as it applies to any business customer / smart phone / etc data for mining. There are some businesses – I won’t name them – that apparently believe big data is about SQL queries and terabyte manipulation transfers. There are some that apparently believe data fusion is about joins and multiplications pretty graphs. If that were the case, then the 22 scientists only need a good text browser and a database able to store 800-odd research reports. The truth is that the big data and fusion do not occur in the database or the front-end browser. It occurs in the person. And unlike in mathematics, this is not a human-made construct. It is not under human control. There is no mathematical proof. And literally the world is watching.
So what is the answer this week?